
Hello everyone!! I’ve had the oportunity to test a forensics tool I am sure you have heard about. It is Belkasoft Evidence Center, a forensics suite that will allow us perform a forensics analysis of a variety of evidence types, from storage devices (or image adquisitions of them) to mobile device adquisitions.
In this post we will go through its main characteristis and we will analyze the goods it offers 🙂 Let’s get going!
Creation of a case and importing a disk image
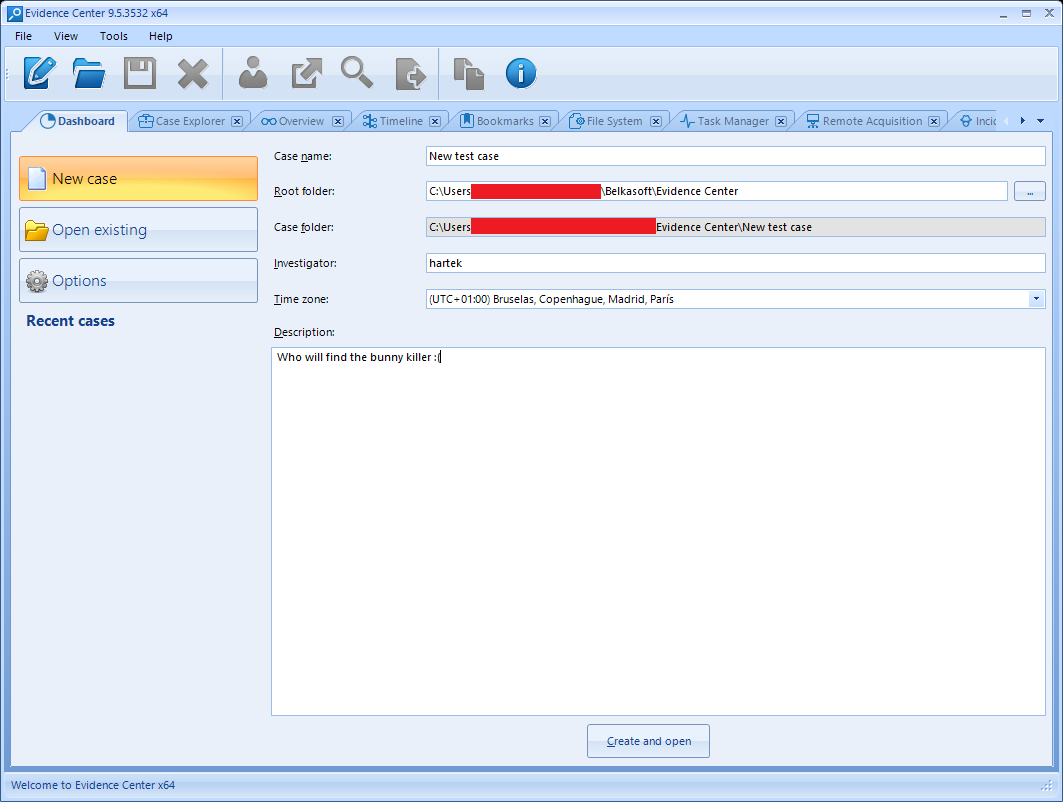
First, we can click the New Case button, easily localized as the first button in the upper toolbar.
We will be asked for some typical forensic investigation data, such as a case name, the directory we will store it, the investigator’s name and the time zone that will be used when visualizing timestamps in the program. We can also provide a brief description of the case.
Once we click the Create and open button a new window will open, asking us to add evidences for the case. As you can see, we can add a wide variety of evidece types:
- Disk images, either E01, AFF, DD…
- An installed storage device on the system (such as a cloned hard drive).
- An backup image from a mobile device, even if it was acquired via JTAG, chip-off or third party tools such as UFED.
- A memory image, such as a memory dump or even a pagefile.sys or hiberfil.sys file.
- A folder containing evidence files.
On the other hand, we are also presented options about about adquiring and anylizing a storage drive, a mobile device or even make an adquisition of a cloud storage account.
In our case we will add a testing disk image, consisting on a VMDK file from a Windows 7 virtual machine created specially for this.
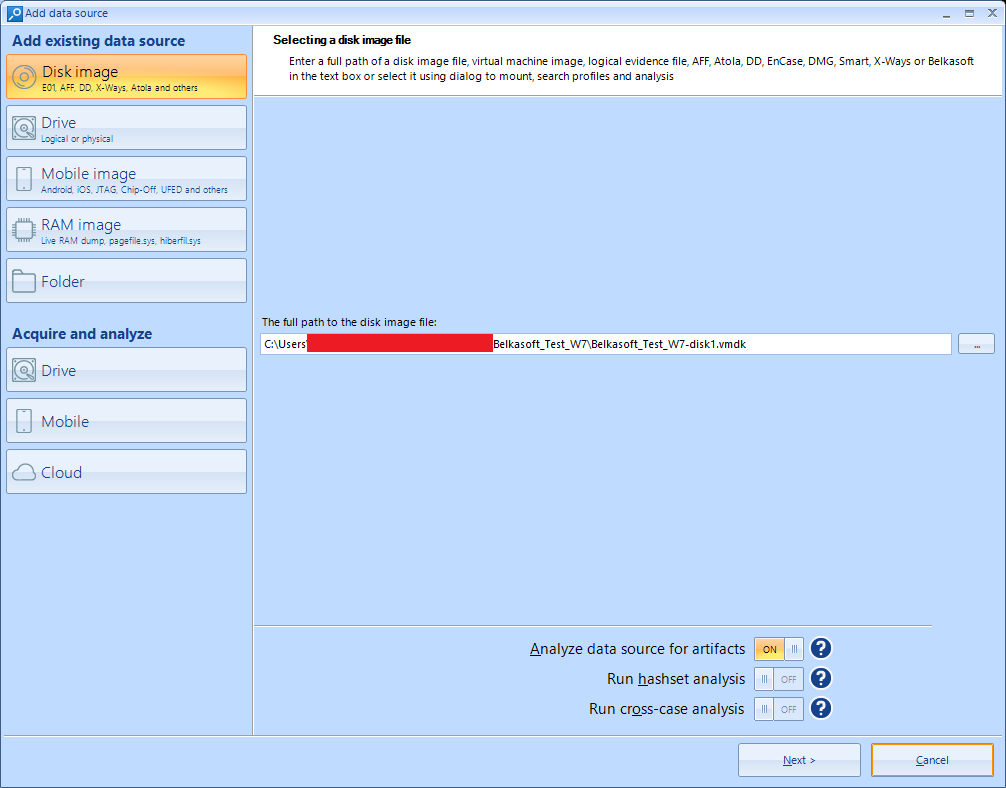
As you can see, we are able to select the options of performing an analysis of the date to find artifacts (which is both preselected and convenient) and also perform a search for files which hash matches a value stored in an internal database in the program. This is interesting if we are looking for a concrete indicator of compromise or IOC in our investigation.
A cross-case analysis will tell us if any of the discovered artifacts also appears in any other case we treated previously.
We will then be asked about the kind of information we want to obtain from the evidence. There is a wide variety of options. We will have to use our logic to deselect the options that we are clearly not interested about, such as the search for data about mobile browsers or MacOS artifacts, given that we are analyzing a Windows evidence.
A possible point of improvement might be not having all of those options preselected if a specific type of file system is autodetected, such as this Windows system.
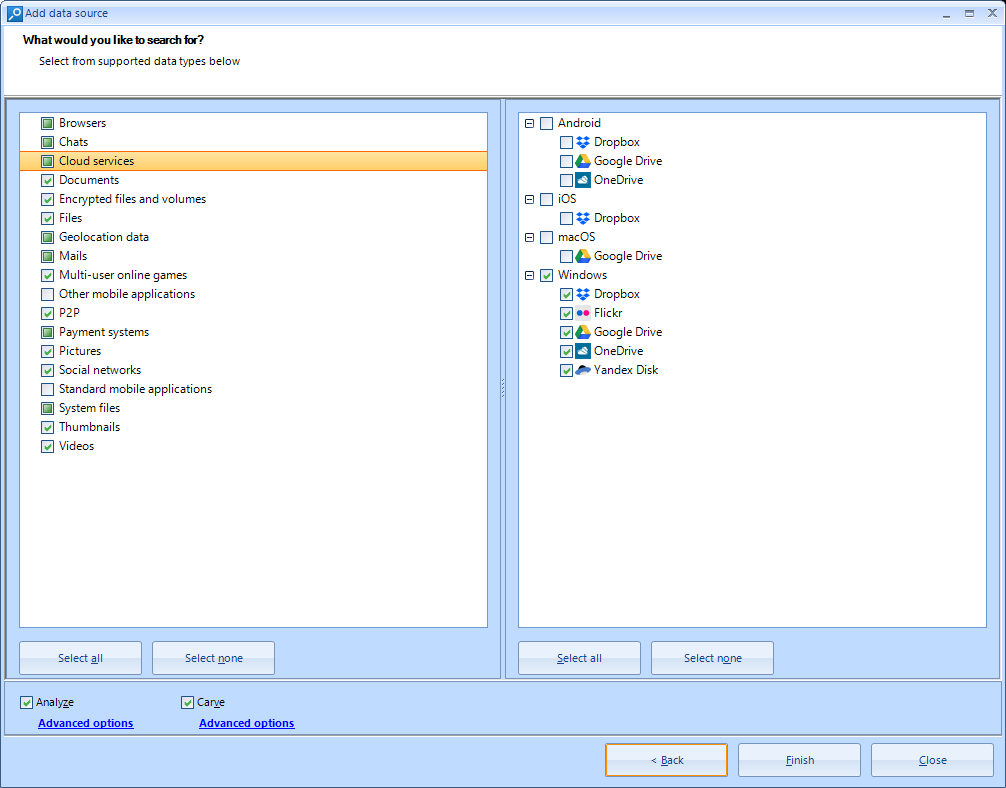
We can both select Analyze and Carve options. The former will perform a full tour and analysis of each file inside the analyzed system, and also try to recover files and information inside the unused file system sectors. The second will allow us to recover deleted information search in the unused disk space, using a filetype signature database.
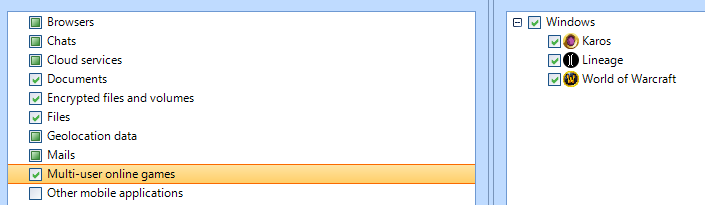
A funny detail I liked is the search of data about online games, such as World of Warcraft 🙂
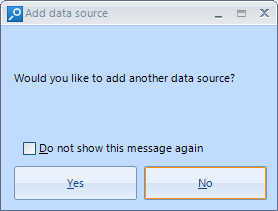
Once we click Finish we will be asked if we wish to add another source of information. For the moment, we will say no and focus on the hard drive analysis.
Automatically we will be sent to the Case Explorer tab, and we will soon start to see diverse artifacts appear on the left panel. We can also see the number of tasks being executed currently. Clicking on this indicator will show us the detail about these tasks and their state, with higher detail if we select each of them, inside the Task Manager tab.
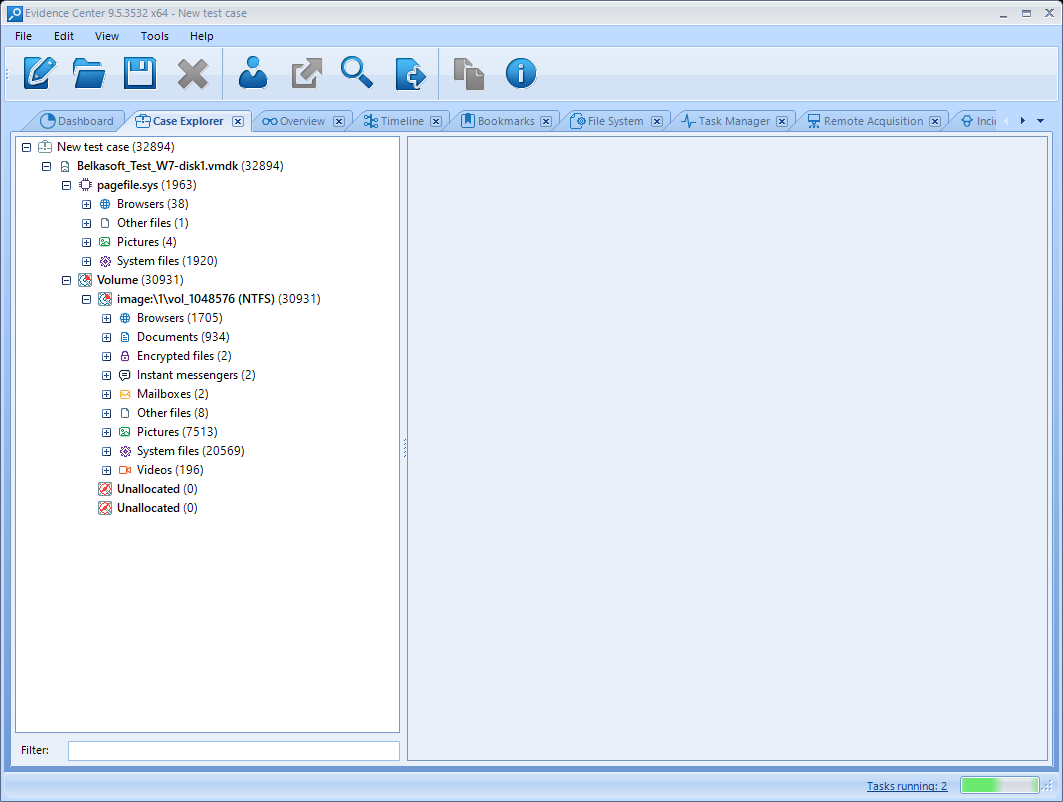
As a comment, for a 40G VMDK image the usage of RAM and CPU was not excessive compared to other products I have tested. It also did not take too much time to complete all the analysis tasks, about 40 minutos in a modern processor. Also, the program did not hang at any moment of the analysis. The tool seems to be nicely optimized.
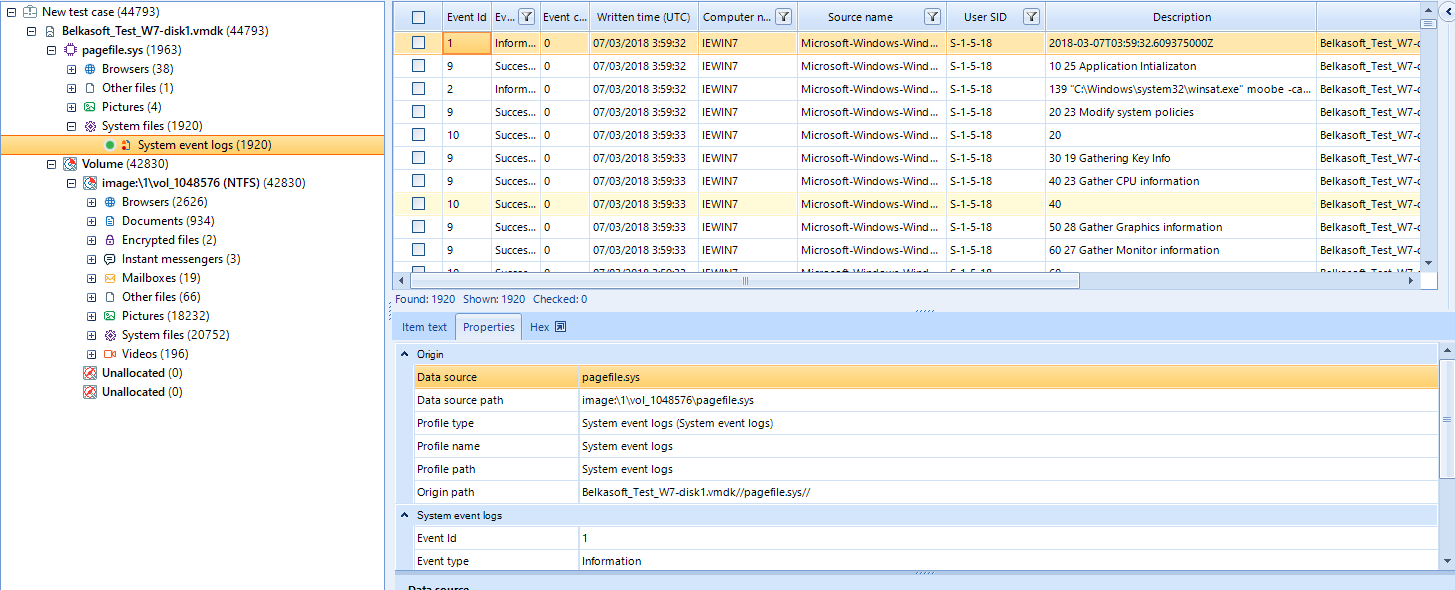
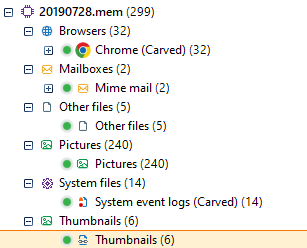
An interesting point is that the tool will automatically find and analyze the pagefile.sys content in the Windows file system, analyzing it as a memory evidence attached to the disk on Case Explorer. It will be able to recover, among other data, information about loaded files or system logs inside this swap memory. In our case, we have found logs about WinSAT, a Windows tool for system hardware evaluation.
Analysis summary at Overview
Once all the pending tasks are finished, we will access the Overview tab, where we can find all the found the most interesting artifacts grouped by category.
These elements are grouped at a high level; if we want to find something specific, we should head to Case Explorer tab as we will later.
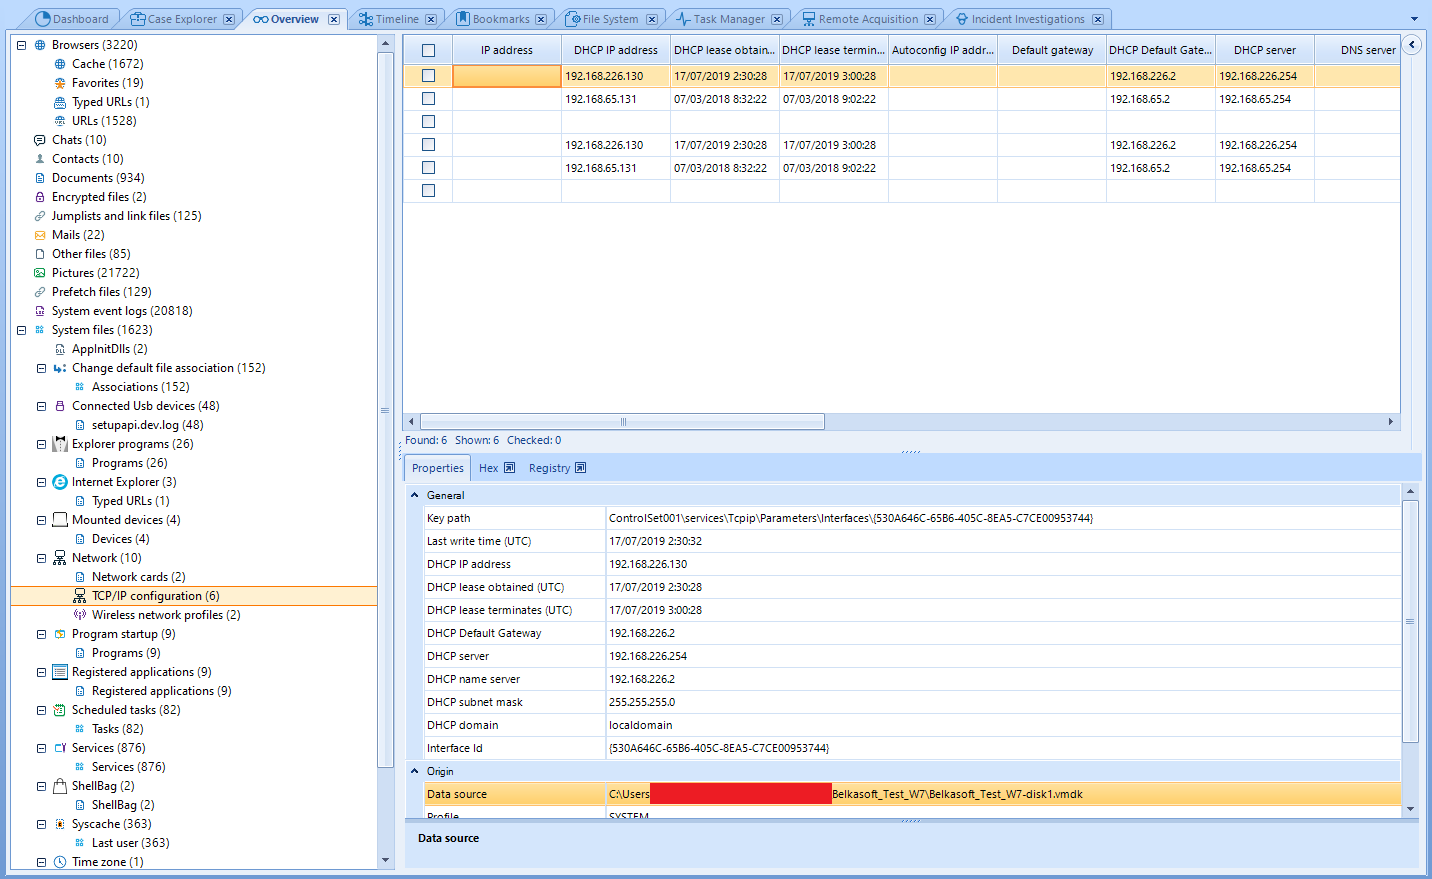
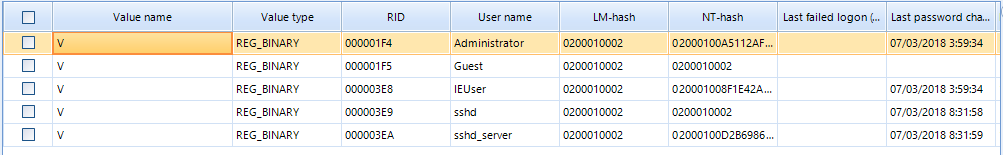
We can quickly find the most savory information here. We can find, for instance, network interfaces and their configurations under the Network category, as you can see in the former image. We can also find the user accounts found on the analyzed system under Windows/Windows accounts.
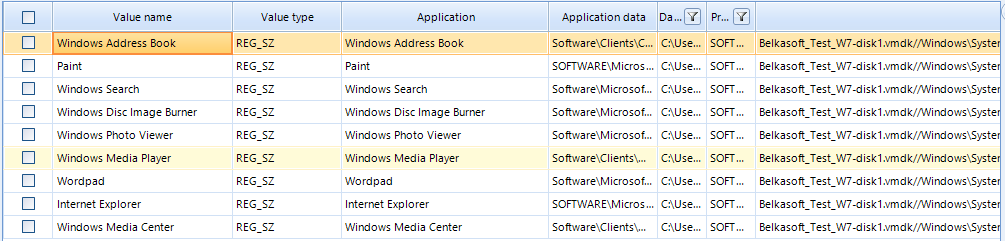
Registered installed applications can be found under Registered Applications and scheduled tasks can also be seen under such entry, allowing us to quickly find usual potentially malicious artifacts.
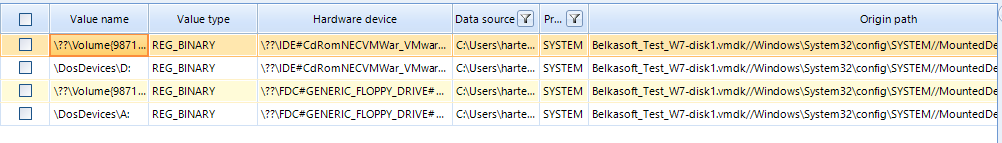
We can also find useful information about the system hardware under Mounted Devices and Connected Usb devices.
Apart from that, we can also find images, videos, documents and other artifacts grouped under the correspondent category. However, we will leave their inspection to Case explorer.
Artifact analysis on Case Explorer
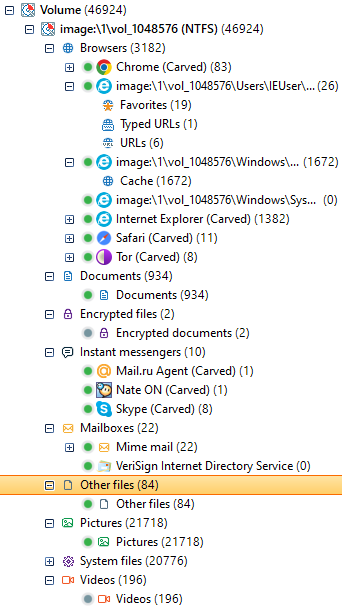
If we head into Case Explorer tab we will find the following types of artifact, all extracted from the disk image:
- Web browser data.
- Documents.
- Encrypted files.
- Instant messaging.
- Mailboxes.
- Other files.
- Images.
- System files.
- Videos.
This is a pretty standard selection that we might be interested about when facing our forensic procedure. Inside each of the categories we will also have subcategories that will help us search and find more concrete artifacts.
Many of these elements will be false positives, which is a very usual fact in this kind of tools when signature-based carving tasks are performed. As always, we will have to manually inspect these elements in case we want to perform a thorough analysis of the evidence.
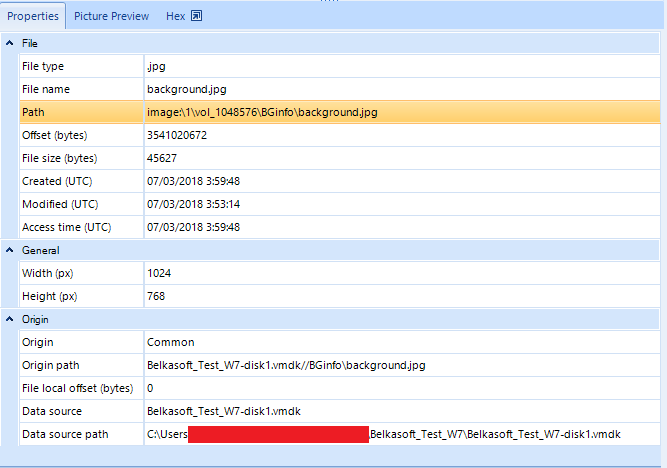
When we select a subcategory, a galery or list will appear on the right panel with the found elements of that type. When we select each of them, its properties will appear on the panel below, such as the file type, its name, its path, its offset on the evidence and its MAC times (Modified, Accessed, Created).
We might find more concrete file types in subcategories, such as image dimensions and a preview in a separate tab. Data related to the analysis itself is also displayed, such as the evidence this element was found in and also a tab that allows us inspect the element in hexadecimal code.
An example of image visualization: 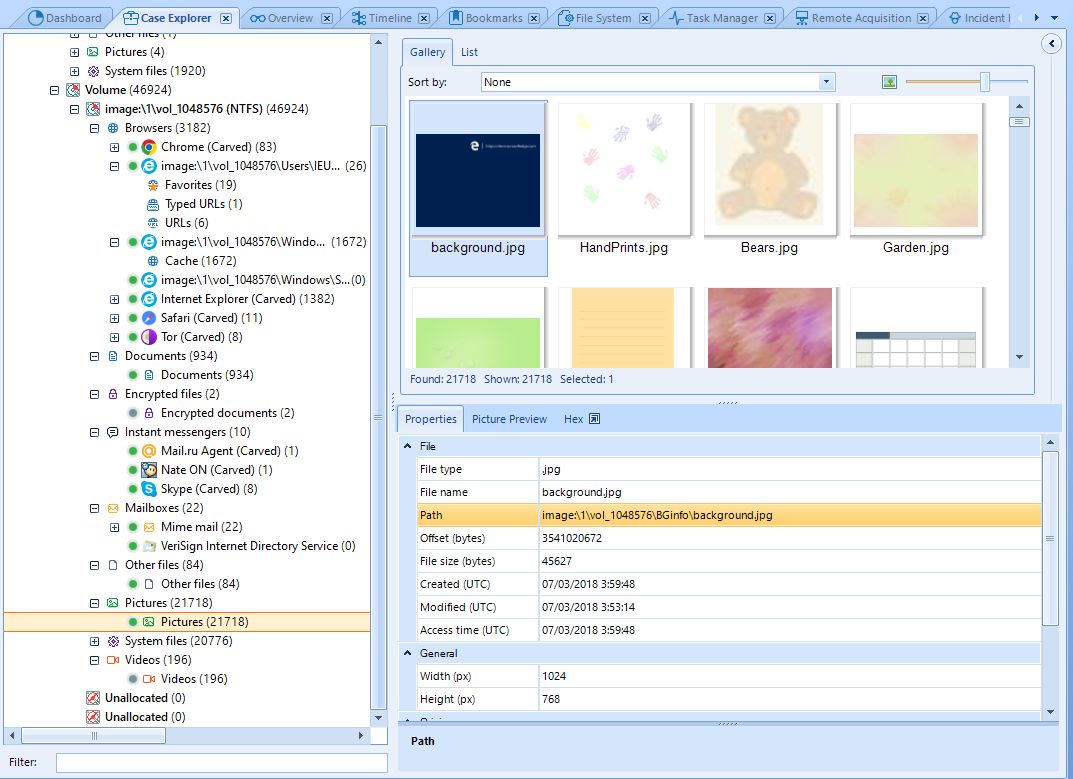
Document visualization, in this time a RTF file:
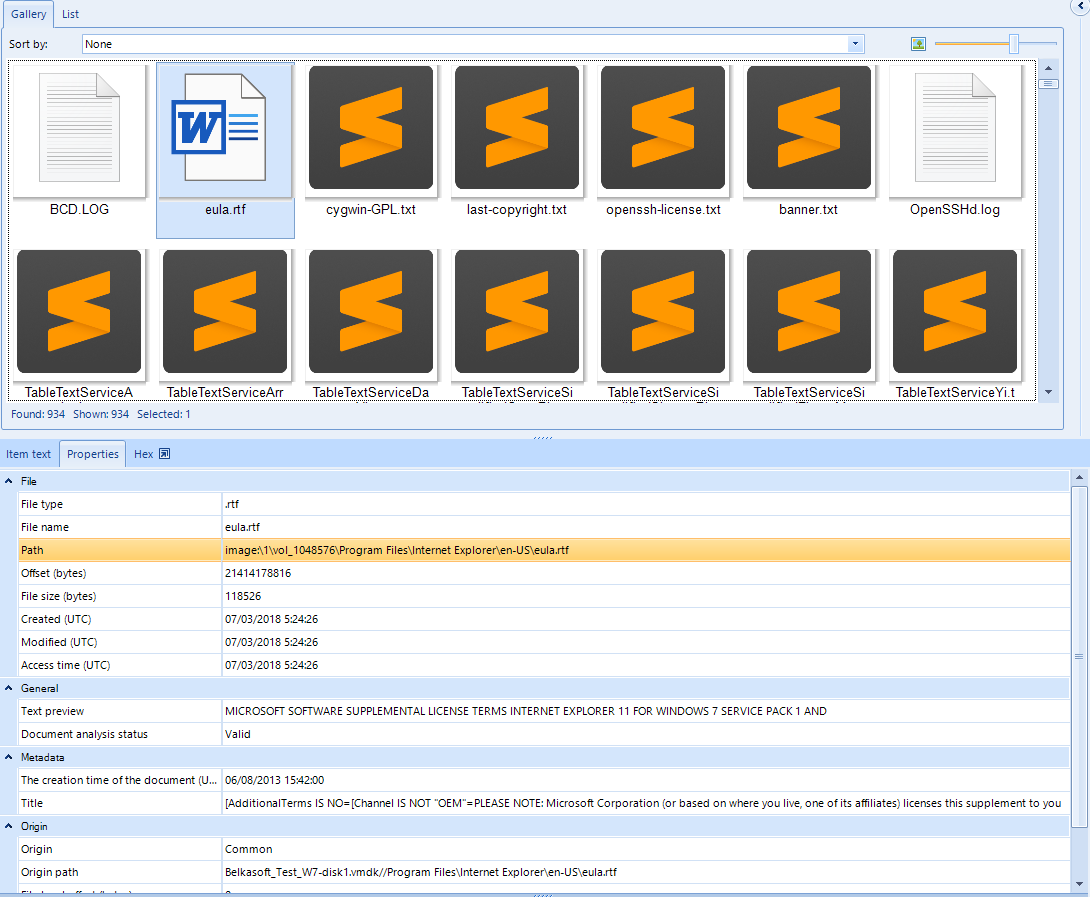
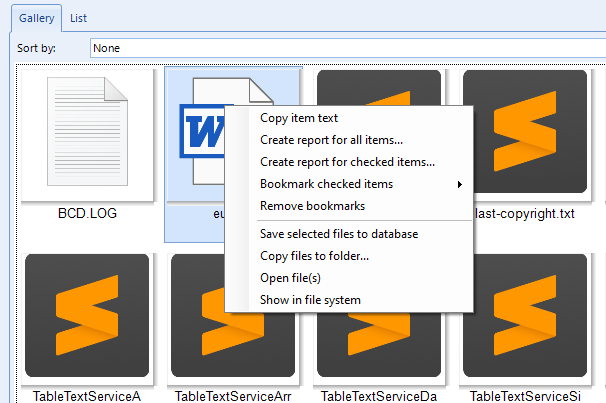
In any case, we can open the file with an external tool right-clicking on it on the gallery. Some other options can be also found when right-clicking, such as creating a specific report for selected artifacts, saving them into a local database, etc.
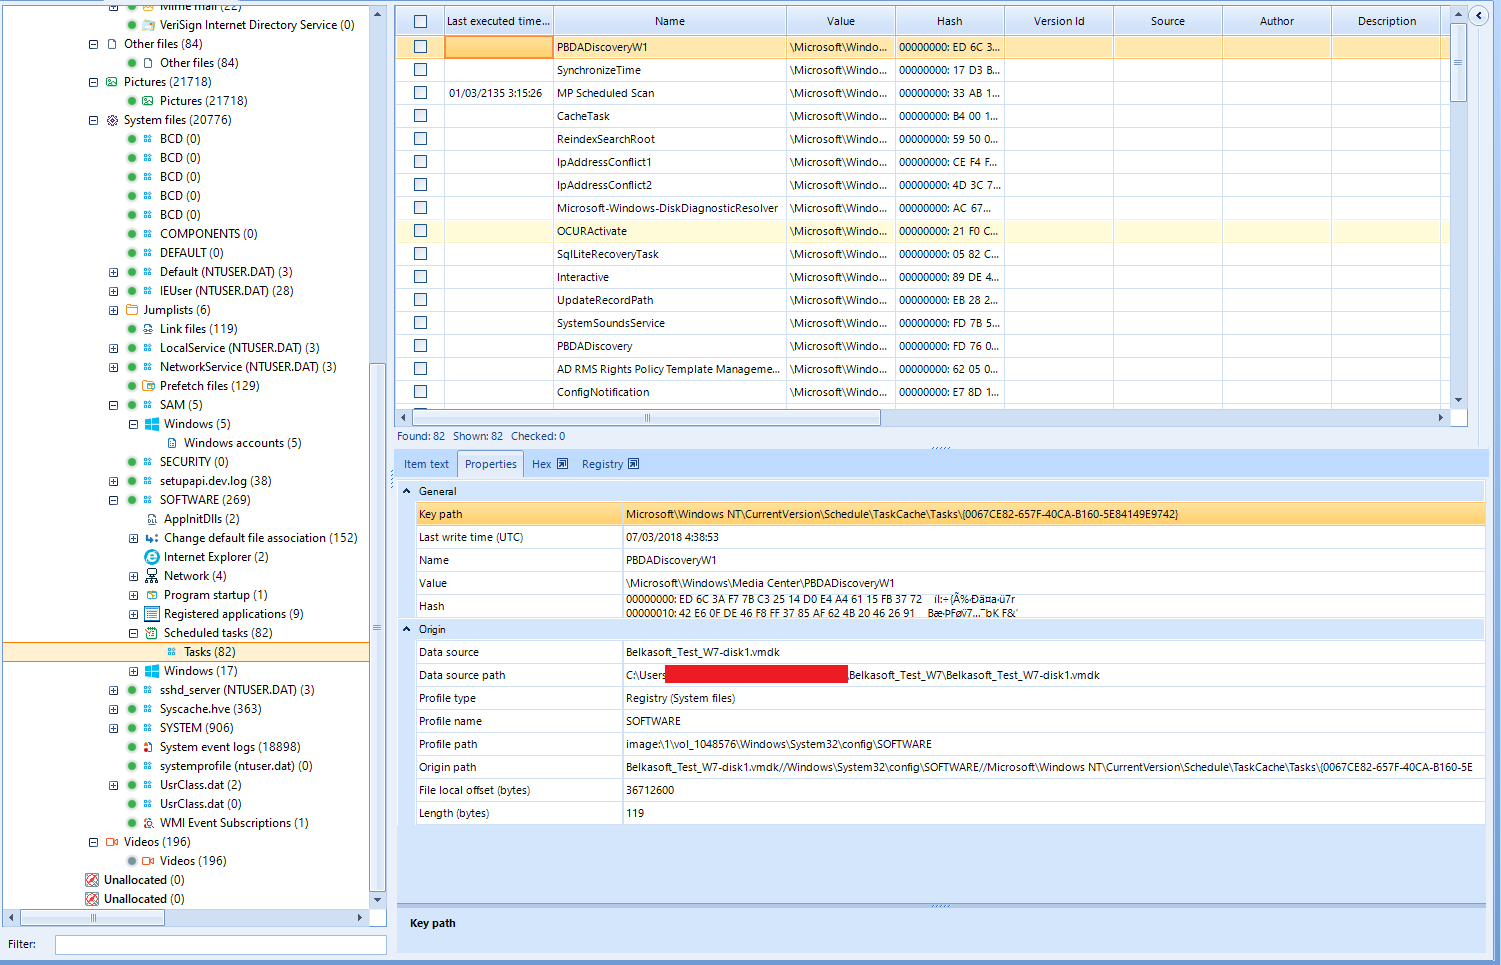
Specially interesting is the System Files category, where we will find among others the registry hives of the file system, both for the users and system-wide.
Present users on the system can be seem in the SAM system hive, or we can see scheduled tasks under SOFTWARE hive. Anyways, we can perform an easier and more intuitive registry inspection under Registry Explorer tab.
File System inspection
Under File System tab, we can visualize the full directory tree and files inside the evidence, in this case the Windows full filesystem. It includes, of course, hidden files.
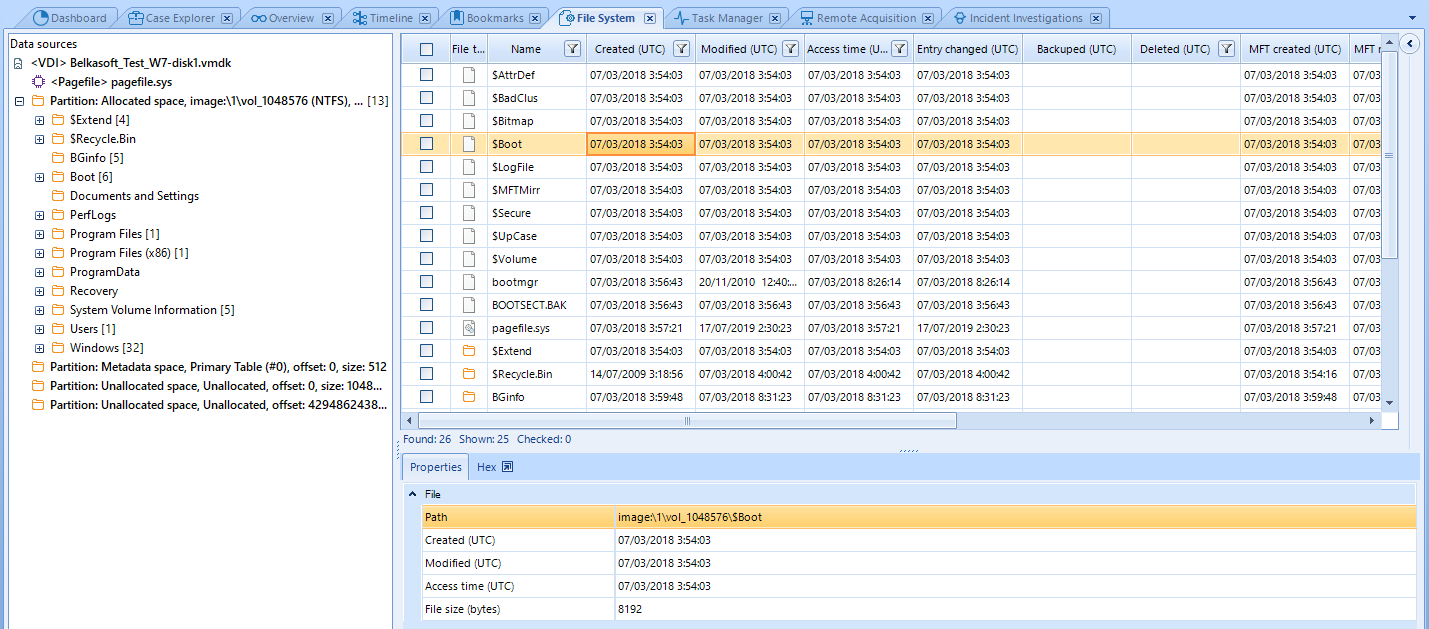
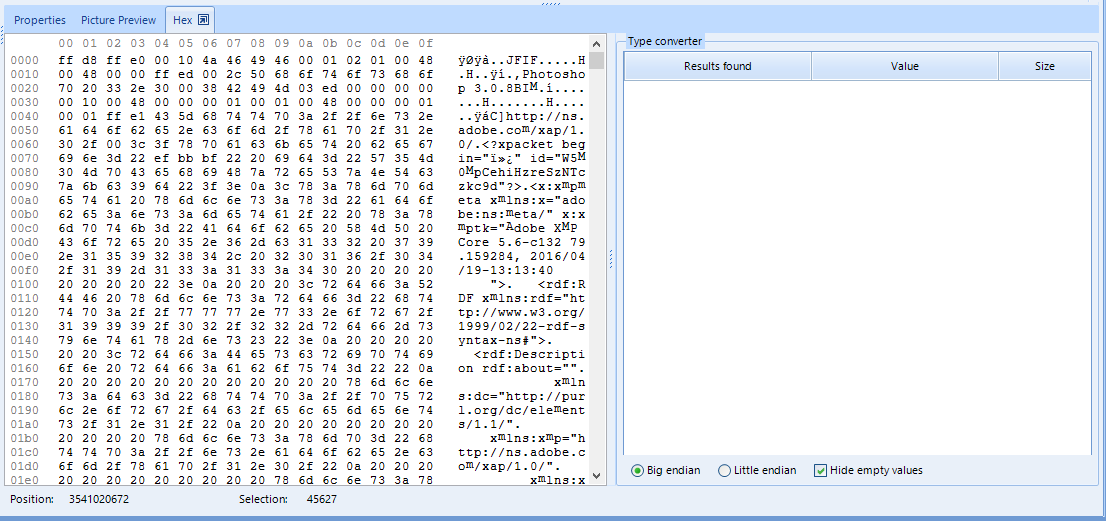
Inside the lower section we can find the currently selected file’s properties, such as the file path relative to the project, MAC times and file size. Aditionally, we can find the same tab we saw before where we can inspect the element in hexadecimal code.
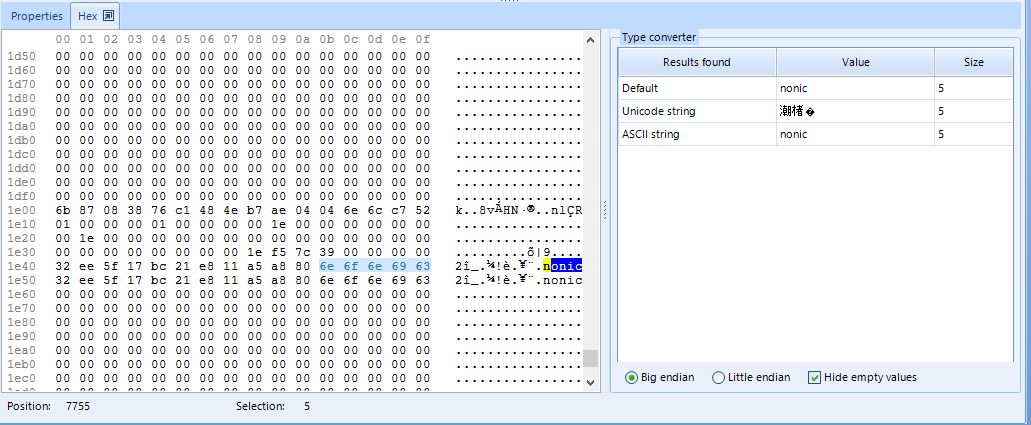
However, this tab does not allow us see plaintext extracted from the file, as we could in Case Explorer. Showing this plaintext here might be an useful point of improvement for the program, given that many files will not be recognized as text files but plaintext strings will be recovered from them. This could be more easily inspected in a specific plaintext tab than reading hexadecimal. We can, however, as you can see in the upper picture, select fragments of the hexadecimal code and convertions to Unicode and ASCII will be displayed on the right side of the hex inspector. It also allows to copy the full text inside the file if you right-click on it and select such option.
Registry inspection
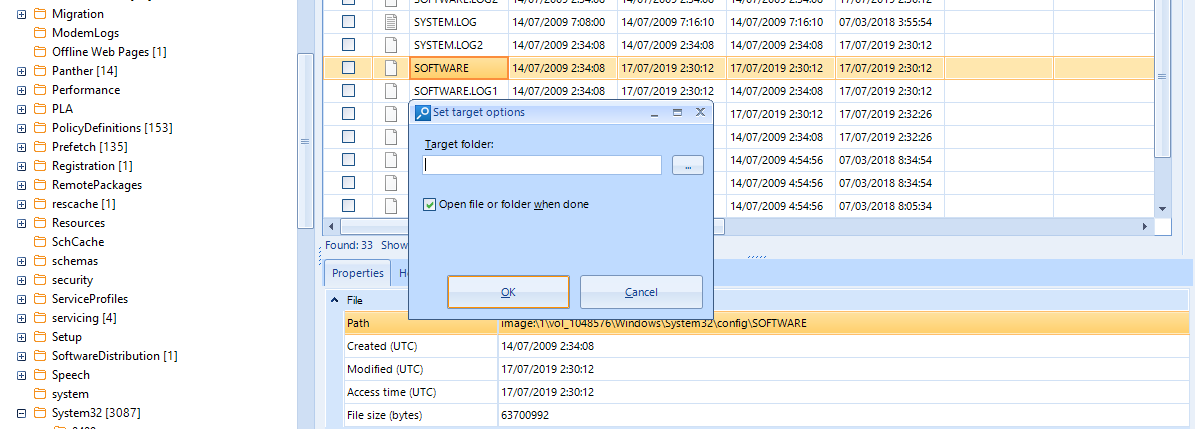
Evidence Center is also able to provide registry inspection functionalities from the hives acquired in the file system analysis. In order to do that, we have to export that hive first from the File System tab. We will take SOFTWARE, for instance.
We have to right-clicn on it and then select Copy files to folder. We will select the destinatino folder for the export and accept the dialog.
After this, we will be able to open Registry Viewer by clicking on View menu and selecting such option. The new tab will prompt us to introduce a hive file to be read. Immediately a tree structure will be shown on the left side, resembling regedit.
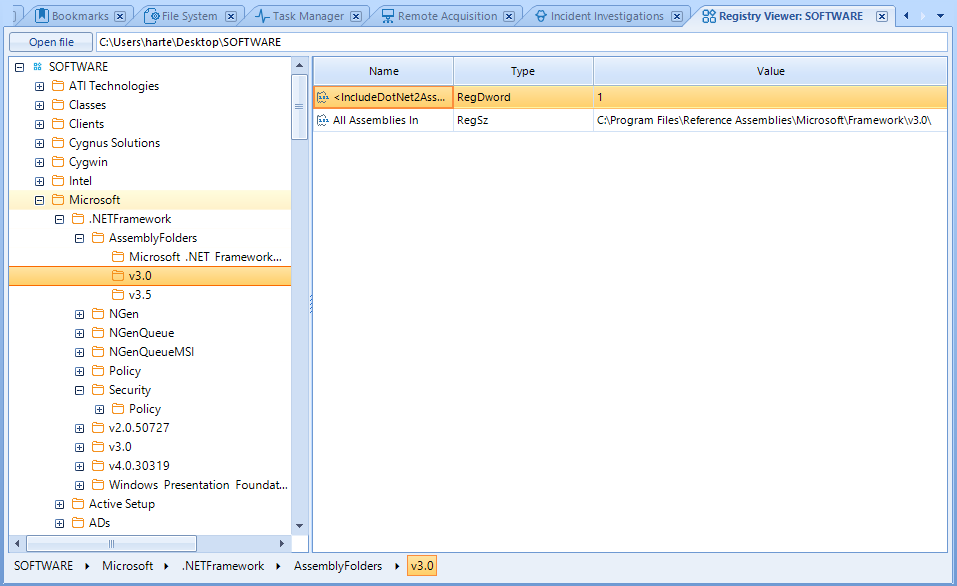
Given that it looks totally like regedit, it is very intuitive to use Registry Viewer. However, I would rather be able to open the hive directly by right clicking on it on File Explorer, saving that time spent on exporting and re-importing.
Timeline
In the Timeline tab we will find a chart showing us all the events detected in the artifacts of the adquisition, such as event logs, file modification or any relevant change or event.
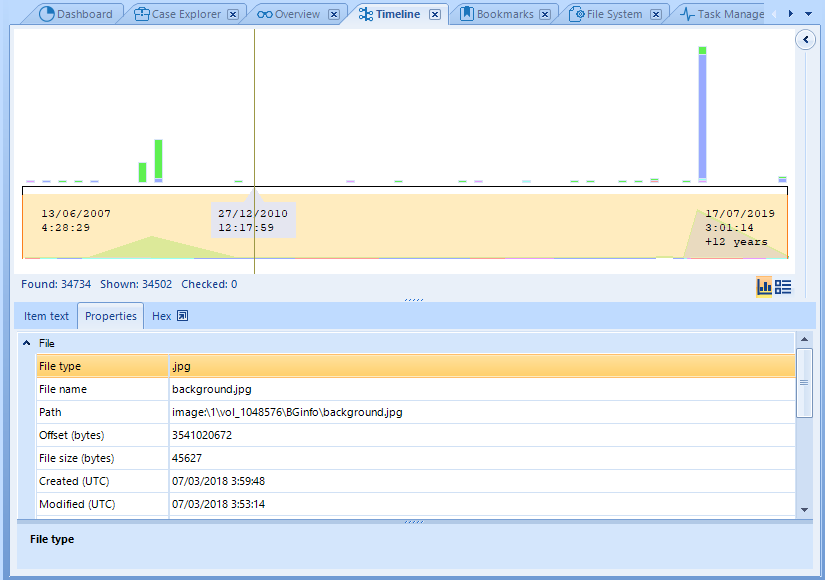
Although the chart can give us a very useful idea about the volume of activity along time, it might be better to click on the button on the right-middle which represents the list view. In this list we will be able to see the most important elements on each event and also set filters over the list.

As you can see in the image, we can see the details of the selected element in the panel below the list.
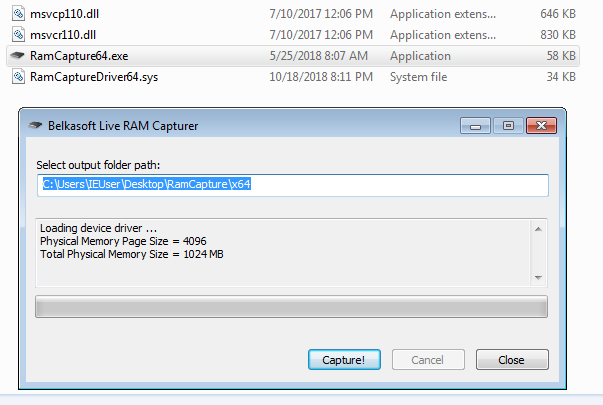
Memory inspection
As we saw when we imported the evidences, it is possible to perform a memory analysis from a RAM memory adquisition. We can use any type of memory dump, sush as the one adquired with another Belkasoft tool, RAM Capturer.
This analysis, however, focuses on artifact acquisition, not showing any other relevant information about processes, MFT and other elements that might be interesting for the investigation.
Hence, we will have to depend on another external tool such as Volatility for memory analysis.
Exporting the case with Evidence Reader
If we want to show the evidences of the case to another investigator, we can execute the export of such case into an Evidence Reader report. A new folder will be created containing this complete export of the artifacts, as well as an executable of such program, which will allow the investigator to explore the evidences in a very similar way to Evidence Center, with only its visualization functionalities.
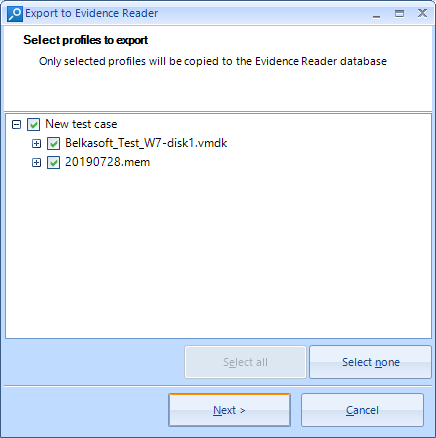
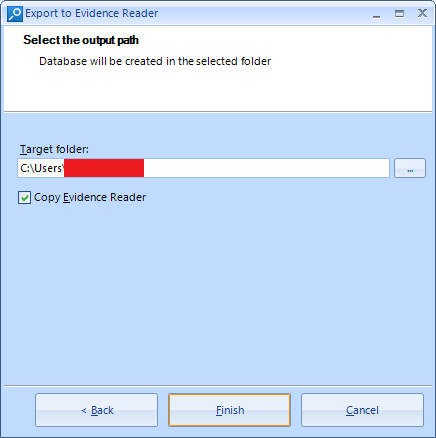
In order to do this, we can click on the Tools menu on the upper toolbar and then Export to Evidence Reader. We will be asked to select the cases and evidences that we wish t o export and where to save this, being able to copy the Evidence Reader into it.
The export process finishes quickly and we will see an explorer window showing the result.
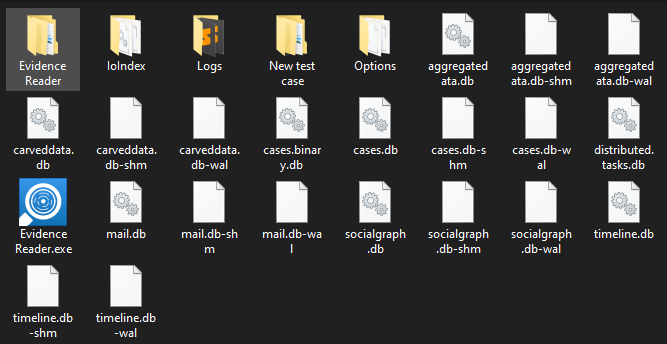
We can easily locate the Evidence Reader icon, being able to open it with a double-click and automatically we will be shown the case with all the evidences that we could see on Evidence Center, with a practically equal interface.
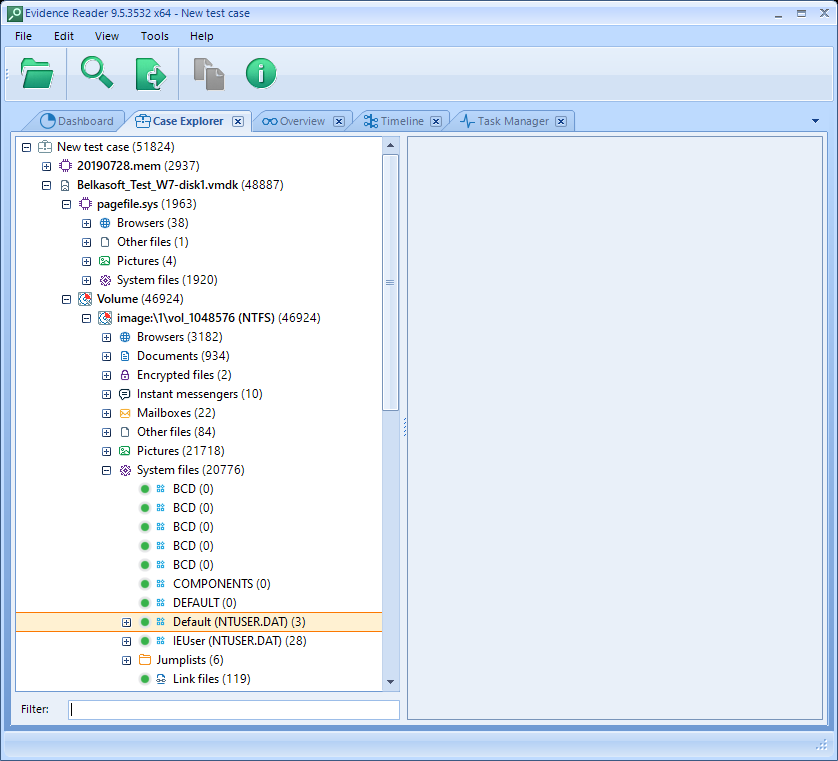
An important detail is that we won’t be able to see the File System tab, only being able to see the artifacts on Case Explorer. This may be caused by the fact that the export does not contain the full filesystem of the evidence, which may lead to a huge export. For the same reason, we won’t be able to export the source files of the artifacts.
A point of improvement might be to export a «dummy» file system, containing only a visualization of the tree structure of the whole filesystem and file names without containing its internal data.
Conclusion
Belkasoft Evidence Center contains a nice and useful toolset for forensic evidences inspection. I specially liked the level of optimization of the suite and being able to inspect the register from inside the application itself.
The timeline will allow you to locate events very quickly and I am sure about the usefulness of common artifact search when analyzing several cases, aiding an internal thread hunting process inside an organization.
The most important point of improvement would be a more advanced RAM memory inspection, using its own methods or using a wrapper over Volatility or similar tools.
I hope you have enjoyed the post and got to know a little bit more about this tool that might help you with your forensic processes 🙂 Greetings and enjoy!!