Feature
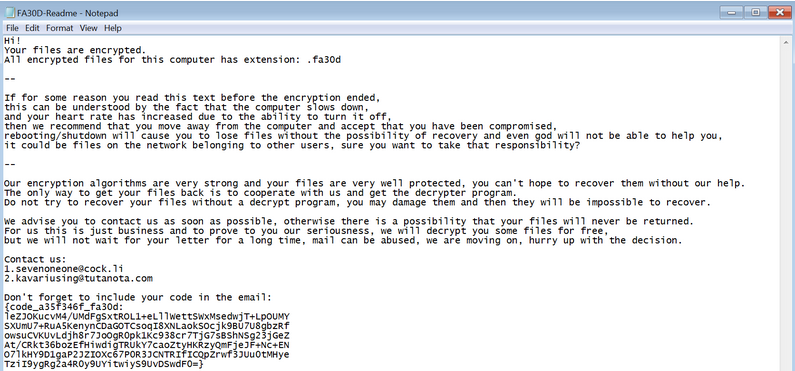
- Filename: exefile.exe
- Sha256: 8639825230d5504fd8126ed55b2d7aeb72944ffe17e762801aab8d4f8f880160
- Interactive Malware Hunting Service: AnyRun
- Type: Ransomware sample, executable for Windows systems protected by a custom packer.
Unpacking custom packer
In this malware sample, the first thing we have to do is see some hint of code section that the ransomware performs, such as crypto functionalities. In such a case we would be with a malware predictably without packer but it is not the case. The ransomware uses self-injection to hide part of the ransomware settings. As the ransomware performs this unpacking in memory, sample debugging is required to locate the MZ header unpacked. Therefore, we will perform this task in the first part of the malware analysis, adding this task further in the reverse engineering process.
As we can see in the sections, we have many bytes in .data that can be an indicator that the malware uses a packer.

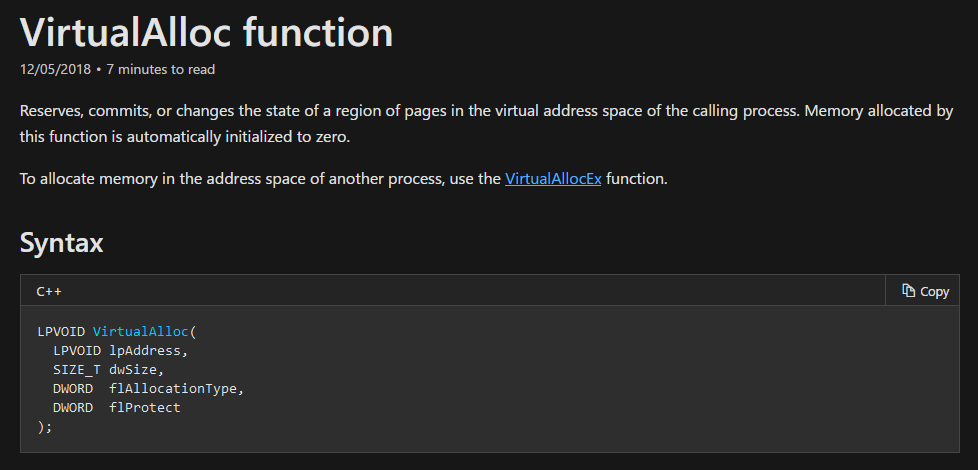
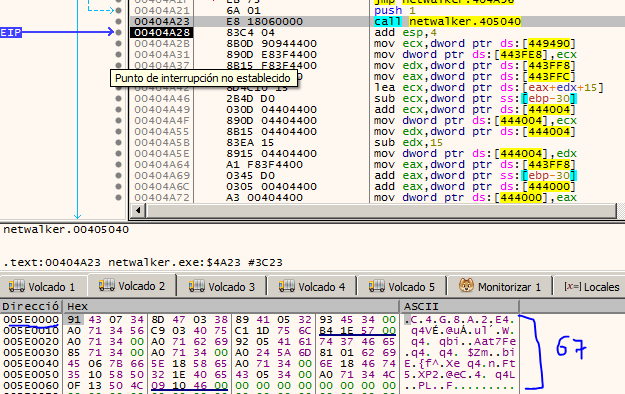
At the first glance of the code using IDA we don’t really see anything interesting, instructions that do nothing. The important point comes when the VirtualAlloc API is called. It is interesting to always keep this API in mind as it reserves memory and is likely to be able to write our unpacked MZ header of PE File. So we can use a debugger to place breakpoints on common unpacking functions: VirtualProtect, VirtualAlloc, WriteProcessMemory, CreateProcessInternalW, IsDebuggerPresent etc… (Malware Unpacking Methodology).
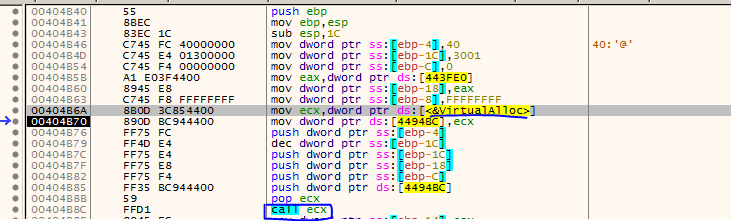
Once you enter the function, within it the API is called using CALL register.
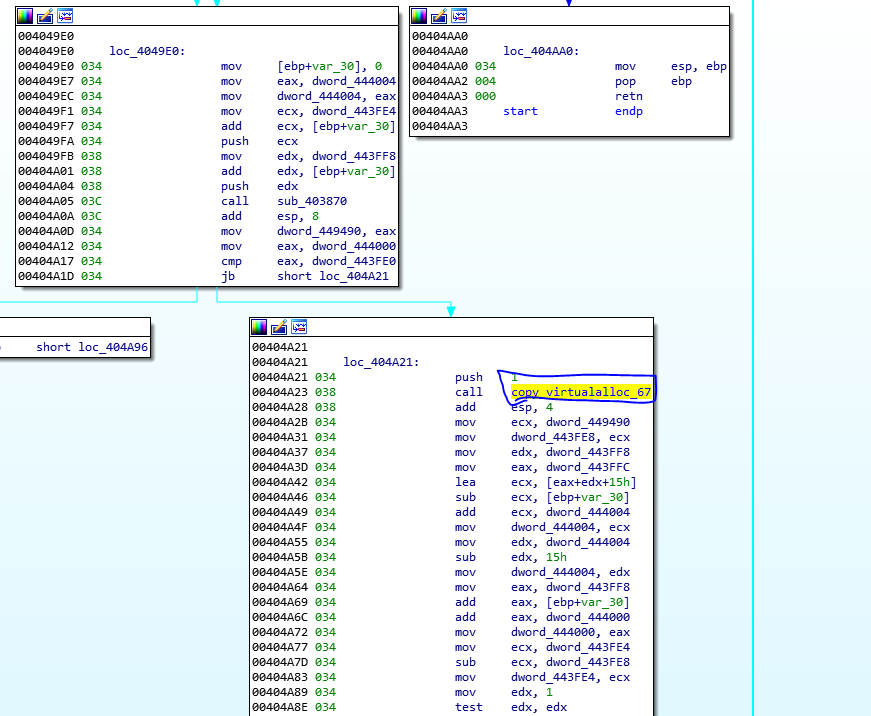
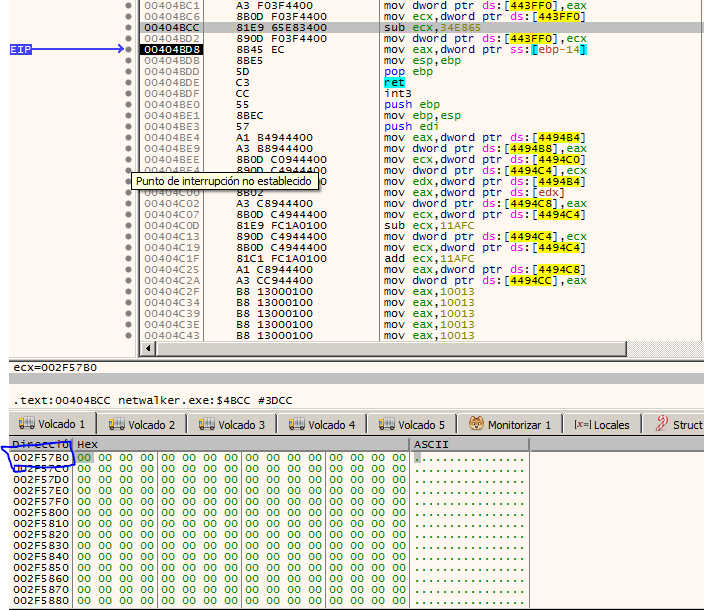
Once the execution function ends, the memory reserved it is used and written to it 0x67 bytes using a loop. The memory address in this execution corresponds to 0x5e0000 but this will be change in the next executions of binary. Copy junk 0x67 bytes of data to reserved memory as picture bellow.
We can check it using x64dbg once it finishs executing the function.
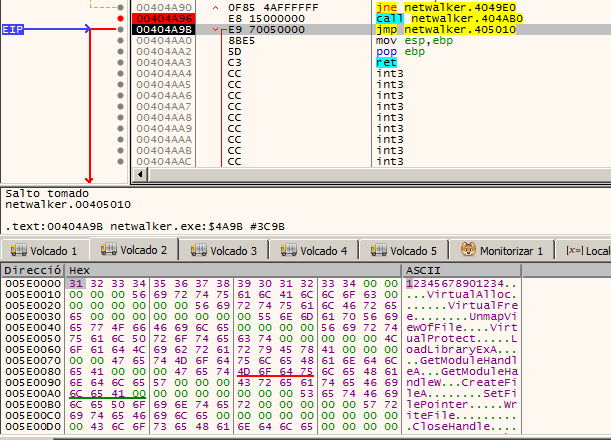
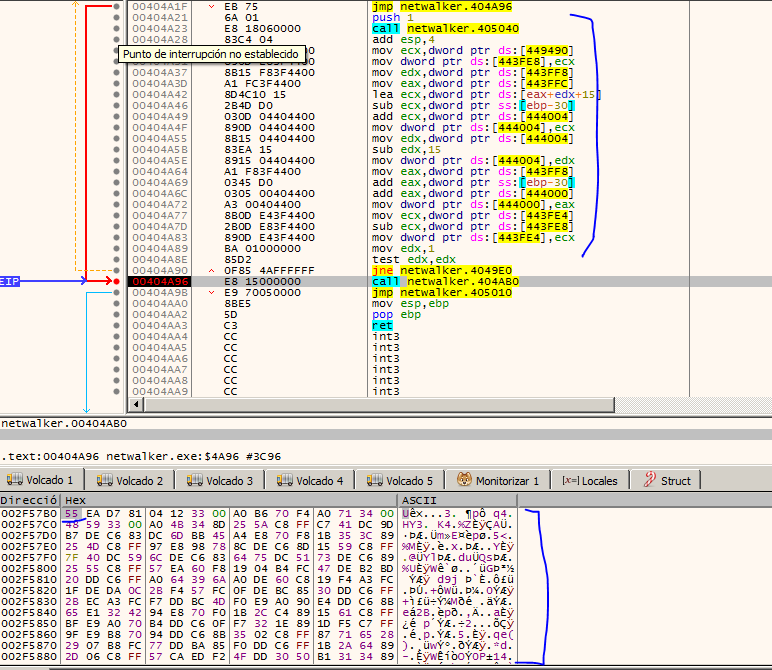
It is preferable that when we understand what it is doing here, put a breakpoint at 0x404A96 and run the program. We will see that all the encrypted data will be copied in that region of the reserved memory.
Well, when we run we find a very interesting function corresponding to probably the decryption of the memory section that was reserved. We could analyze it, but basically it contains the APIs that will be used later (probably), and we also find an indicator of an encrypted MZ header of PE file.
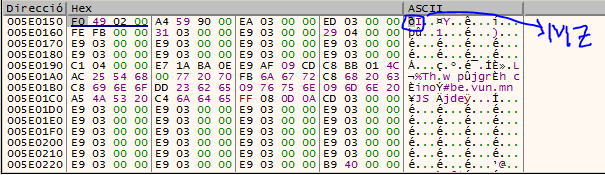
And here we see our (probably) encrypted MZ header of PE File. If this is really the encrypted MZ, we should continue debugging in order to know where it is decrypted and to be able to obtain the dump from the memory map (that is, another VirtualAlloc). But where is it decrypted?.
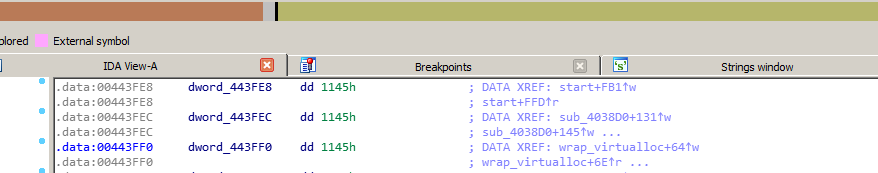
Later, we already finished into a JMP to Shellcode. This shellcode is likely to have been written to some function that we have overlooked. The best way to discover the «how» is simply by looking at the references to that jump. 0x55 -> Prologue byte of shellcode function indicator as picture bellow.
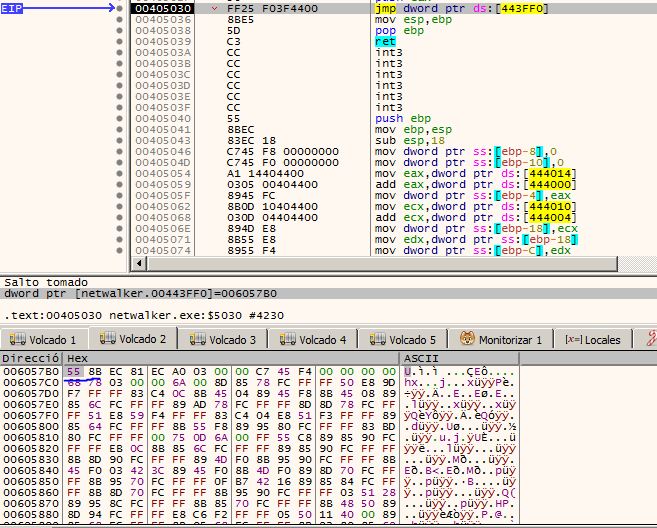
Looking at the code references the address corresponding to 0x443FF0 corresponds to .data and points its reference to inside the function where the VirtualAlloc API was called. The next step would be to debug the packer again (the memory address of both the shellcode and the one reserved with VirtualAlloc will change).
Once the function is debugged again, we realize that it stores the memory address of the shellcode, basically it makes sense since a JMP is performed on the content of 0x443FF0. Well now that we know «where» the shellcode pointer is saved, we are going to analyze again when the shellcode is going to be written in that memory address, although for us the important thing is already done, which is «when» is going to execute the shellcode . Once we have located it in one of our dumps in x64dbg, we continue debugging from within the function where VirtualAlloc is called. In this case the memory address of the shellcode will be the one you will see below:
It is in the loop where a function was called that copied 0x67 bytes to the reserved memory, the shellcode copy is also made in that memory address. We can check it as before, putting a breakpoint and be aware of memory.
Once seen this we can continue with the JMP and debug the shellcode. Still we can verify that we were right.
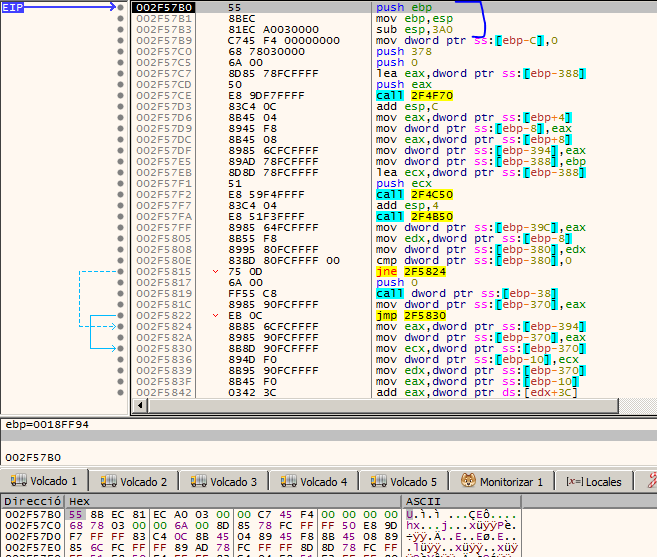
The addresses of the shellcode are random except for the lower part of the address, therefore in the memory address that ends as 0xFB0 we have a CALL opcode. We realize that the memory address containing our encrypted MZ header of PE file is pushed as an argument.
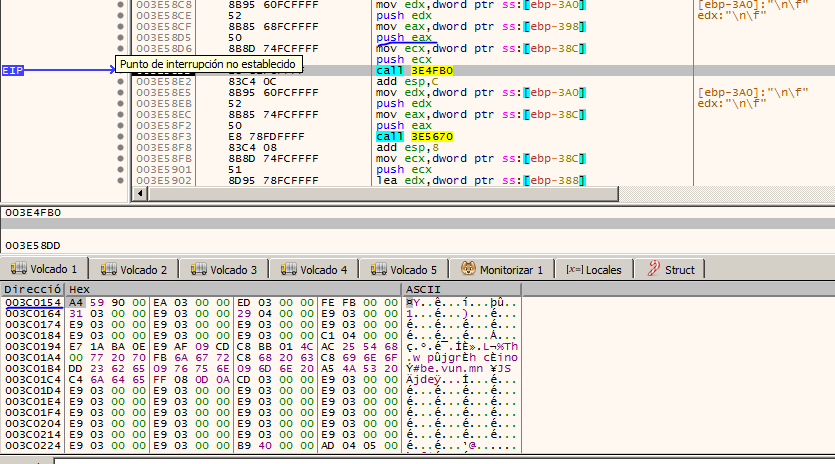
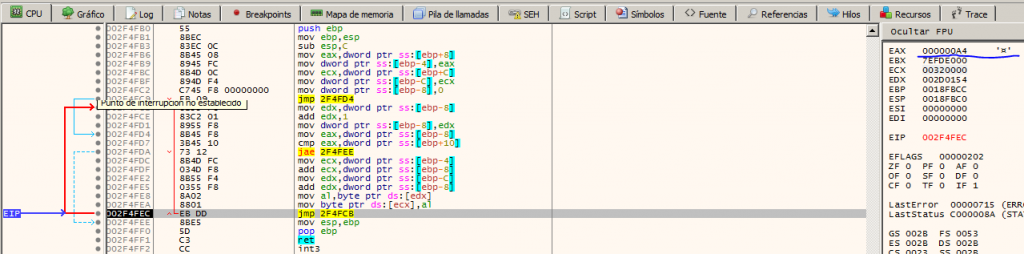
We enter the function and locate a loop and it dumps each byte of our encrypted MZ header to another region of memory, it is likely that in this region of memory is our final payload. Byte to Byte iteration and copy into memory as picture bellow.
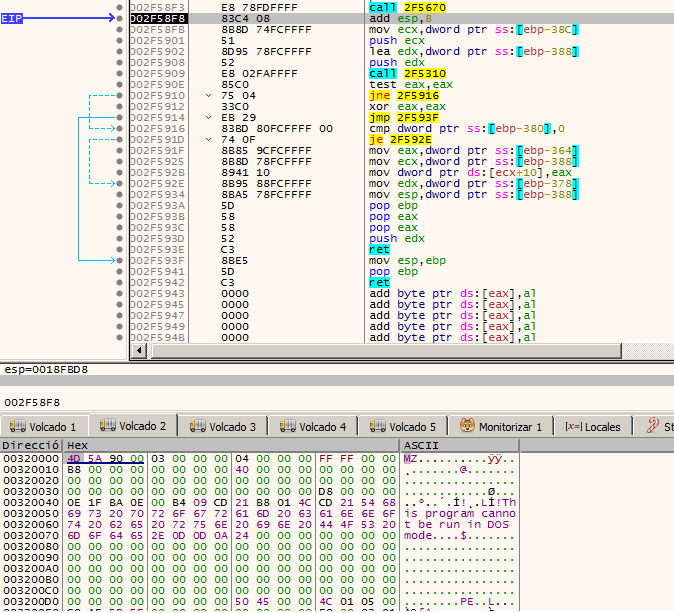
Therefore if we put a breakpoint in the following instruction after the JMP instruction, we can see that everything was copied. Finally, in the following function, an argument is put to the stack, in the EAX register corresponding to the memory address where the payload was copied. Once the CALL is executed, we will have our unpacked malware and ready to perform a dump and be able to continue in the next stage.
To check if that is really the malware, we have to open it with IDA and see if the strings match the malware without the packer (in case someone has already analyzed the malware), if not, we can open it with x64dbg and try to execute it , if it does not crash, everything would be correct.
Although it is true, we not only have to settle for already having the unpacked malware, because the shellcode really continues to run and we do not know if any argument is passed to that binary or something special.
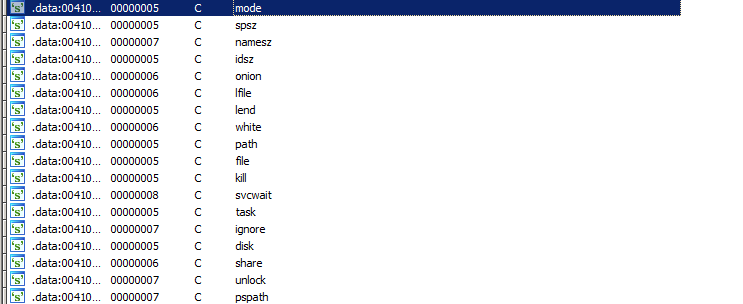
We can identify the strings used in NetWalker malware.
Thanks for reading and any suggestions or questions contact me on twitter @naivenom